 PRODUCT
Production Readiness Dashboard
A Next.js and PostgreSQL operations dashboard for workspace-scoped service health, check history, event triage and manual incident review.
01 / The problem
Where the friction starts.
An operations dashboard can look healthy while its underlying services have not been checked. Teams need state derived from actual recorded checks and events, with different privileges for operators and viewers.
02 / The experience
A more useful way through.
The source implements a workspace-scoped service registry, recorded health checks, operational-event triage and manually created incidents. The dashboard uses persisted operational data rather than invented uptime percentages, readiness scores or monitoring history.
Shows how a multi-role operational control surface can make check history and failure states reviewable. It is not evidence of a deployed monitoring service or a production SLA.
03 / The workflow
- 01Sign in to a workspace with Owner, Admin or Viewer permissions
- 02Inspect configured services and their persisted health-check history
- 03Authorized operators run manual checks against validated service targets
- 04Review operational events and record manual incident escalation
- 05Inspect readiness status and explicitly unavailable integrations
Source-implemented dashboard capabilities
Technology & integration areas
Next.js / React / TypeScript / PostgreSQL / Prisma / Vitest / Docker
04 / Current evidence
In Development
Running local application verified on 4 November 2026 with a new PostgreSQL fixture database and actual healthy/503 manual check history. The full suite recorded 155 passed and 11 failed. No production deployment is claimed.
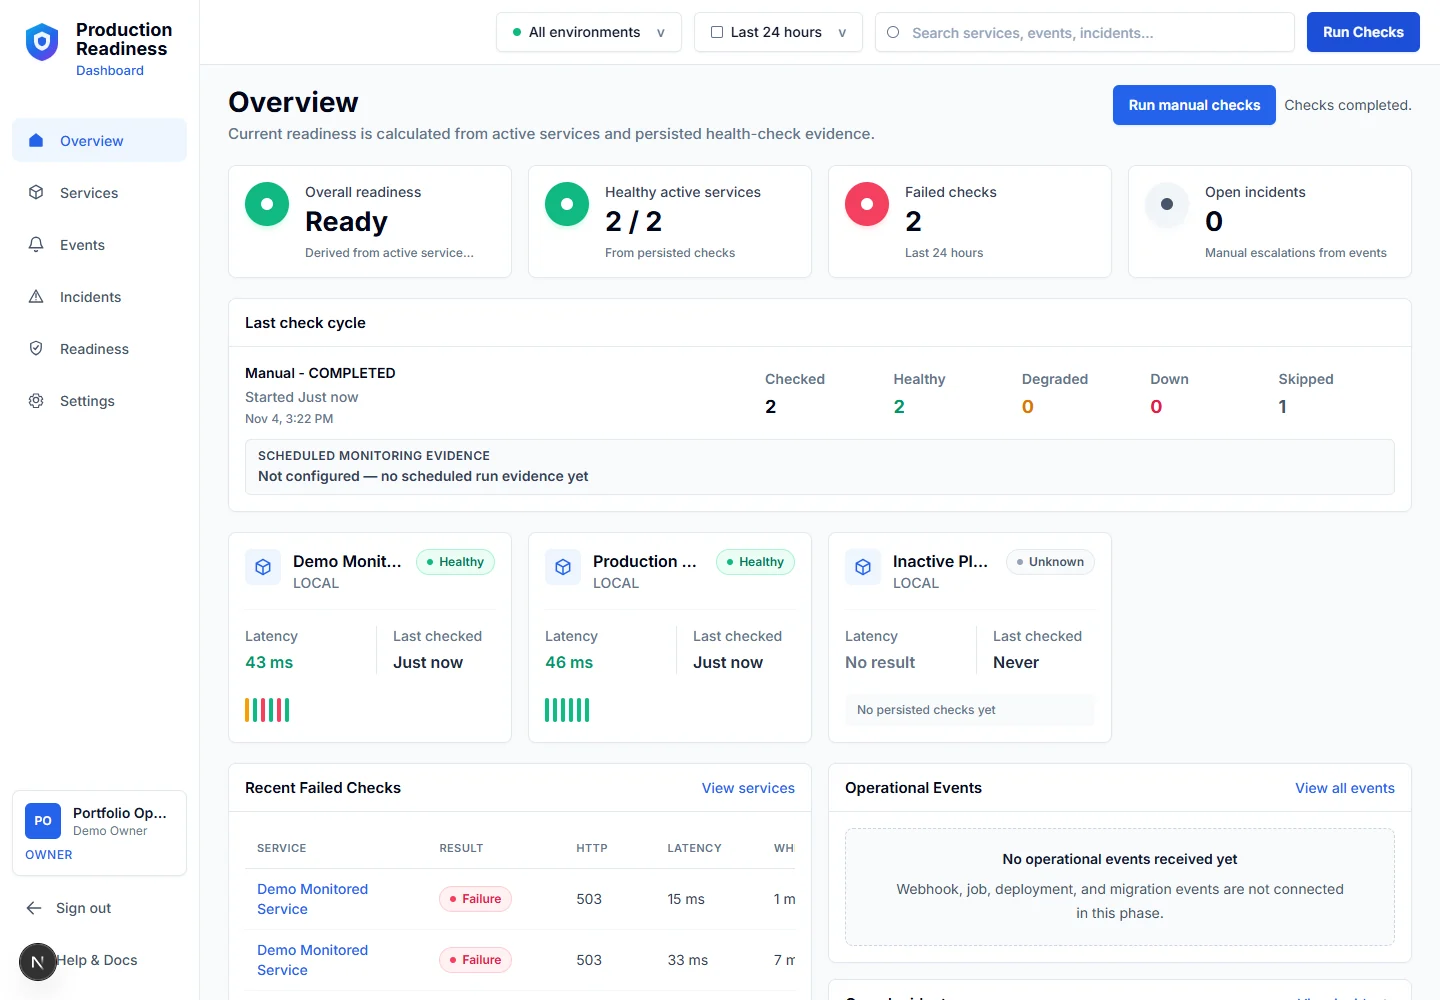
4 November 2026 — Authenticated local dashboard after actual manual checks against loopback fixture endpoints. Values are recorded fixture results, not production monitoring metrics.
- Source inspectedRevision used for execution
- Public source, migrations, frontend, server actions and execution logic inspected at ac2e72a4f885ea6454f4f21f55c554ca36b1fa44 on 4 November 2026. Inspect revision used for execution (new tab)
- Browser inspectedAuthenticated local runtime
- Desktop and mobile dashboard, service detail and persisted healthy/failing check history were captured from the running application using a fresh fictional workspace. All monitored endpoints were local fixtures.
- PendingProduction operations
- No cloud deployment, live service monitoring, scheduler, notifications or incident response operation was verified.
05 / My contribution
Decisions I owned.
I worked on a product-style operational dashboard with service registration, role boundaries, health-check workflows and evidence-backed status views. The repository provides the implementation and runbook; this page does not claim production adoption.
Technical architecture
Next.js App Router renders a React/TypeScript dashboard. Server actions resolve the authenticated session, workspace membership and role before mutations. Prisma persists services, check runs, history, events and incidents in PostgreSQL. A bounded HTTP executor validates targets and stores actual responses. The proof run used a new loopback-only PostgreSQL database with the repository migrations and fictional development seed.
06 / Engineering decisions
Why the system takes this shape.
- Derive status from records
- A service with no persisted check remains Unknown. Health, latency and incident views must be based on recorded events, not decorative metrics.
- Enforce workspace boundaries server-side
- Owner/Admin/Viewer access is resolved from the server session and membership records. The Viewer role cannot mutate services or run checks.
- Keep the public demo isolated
- The optional read-only public-demo workspace is disabled by default and requires explicit configuration and a recent persisted healthy self-check.
Implementation / Reviewed source
The logic behind the interface.
Selected exact source excerpts inspected on 4 November 2026. Public repositories link to the executed revision. Private-source selections are authorized for this review draft; final publication approval remains pending.
Workspace and role checks precede execution
The server resolves the signed-in workspace and denies a role without check permission before requesting a workspace-bound run. UI control visibility is a separate convenience.
src/server/dashboard/actions.ts · lines 35–51
export async function runManualChecksAction(formData: FormData) {
  const returnPath = getReturnPath(formData);
  const dashboard = await getDashboardContext();

  if (!dashboard) {
    redirect(`/signin?returnPath=${encodeURIComponent(returnPath)}`);
  }

  if (!canRunChecks(dashboard.context)) {
    redirect(`${returnPath}?checks=denied`);
  }

  try {
    await runHealthChecks(undefined, {
      workspaceId: dashboard.context.workspaceId,
      triggerType: HealthCheckRunTriggerType.MANUAL,
      requestedByUserId: dashboard.context.user.id,
Public source at verified revision · revision ac2e72a.
Inspect src/server/dashboard/actions.ts at ac2e72a (new tab)Validate the target and bound the request
The runner validates its service target, sets a timeout and requests manual redirect handling. The excerpt shows execution mechanics; the full source contains response classification and persistence.
src/server/health-checks/execution.ts · lines 98–106
    const targetUrl = await validateHealthCheckTarget(service, {
      environment: options.environment,
    });
    const controller = new AbortController();
    timeout = setTimeout(() => controller.abort(), timeoutMs);
    const response = await fetchImpl(targetUrl, {
      method: "GET",
      redirect: "manual",
      signal: controller.signal,
Public source at verified revision · revision ac2e72a.
Inspect src/server/health-checks/execution.ts at ac2e72a (new tab)Verification / 4 November 2026
What actually ran.
Recorded local execution, with fixture scope and unresolved failures kept visible. These results are separate from the portfolio’s own build checks.
npm run test155 passed · 11 failed (166 tests)- Fresh Vitest run at ac2e72a. All 11 failures are in tests/run-production-db-command.test.ts: dynamic module loading raises SyntaxError: Invalid or unexpected token on this Windows harness. A focused rerun reproduced them; they remain unresolved.
prisma migrate deploy → prisma db seed → local dev → Run ChecksActual healthy and HTTP 503 records persisted- Applied nine migrations to a fresh local PostgreSQL database. Signed in as a fictional fixture Owner, ran actual manual checks, then changed only the local fixture endpoint to return 503 and ran checks again. Captures show real check history and derived failure state. No incident history was seeded or invented.
07 / Limits & learning
What still needs proving.
- This local fixture run does not establish hosted production monitoring, an SLA or real customer usage.
- Eleven production-database-command harness tests fail on Windows; the complete suite is not green.
- No live service data, real incident history, external integrations, paging, automatic remediation or background scheduler was exercised.
- The optional public demo remains unverified. No credentials or database access are included in this portfolio.
What I learned
Operational credibility depends on explaining unknown states, preserving actual check history and treating permissions as backend rules rather than UI labels.
08 / Actual screenshots
From the running local application.
Captured directly from a running local application on 4 November 2026 using newly created fictional fixtures. These are actual application screens, not production activity. Open a screen to inspect it; use the arrow keys to move and Escape to close.
4 November 2026 — Authenticated local dashboard after actual manual checks against loopback fixture endpoints. Values are recorded fixture results, not production monitoring metrics.
4 November 2026 — Demo Monitored Service and its persisted local check history after an actual healthy response.
4 November 2026 — The same fixture service after its endpoint was switched to return HTTP 503 and another manual check executed. The failure and history were recorded by the application.
4 November 2026 — Local mobile overview after the intentional 503 response: readiness is Blocked and one active service is healthy. No incidents were invented.